
close
Choose Your Site
Global
Social Media

Author: Site Editor Publish Time: 2025-07-23 Origin: Site


Austenitic stainless steel price levels in 2025 show significant differences across regions. The table below highlights current prices for 316 grade:
| Region | Stainless Steel Grade | Price (USD/MT) Q2 2025 |
|---|---|---|
| USA | 316 | 3,376 |
| China | 316 | 1,589 |
| Germany (EU) | 316 | 3,012 |
US prices have risen sharply, mainly due to higher tariffs and cost pressures. Buyers and planners need to track current prices and market trends to manage budgets, secure supply, and optimize procurement decisions.
Austenitic stainless steel price levels for 2025 show clear differences between grades and regions. Grade 304 remains the most widely used, while grade 316 commands a premium due to its higher alloy content and corrosion resistance. The following table summarizes the average 2025 price range for both grades:
| Grade | Average 2025 Price Range (per ton) | Regional Price Details |
|---|---|---|
| 304 | $3,500 - $4,000 | Europe faces weak demand and price pressure from Asian imports. US prices reflect domestic policies and flat demand. Asia sees rising prices due to industrial growth. |
| 316 | Starting at $3,500, can exceed $4,000 | Similar regional context as 304. Higher alloy content drives price above $4,000 in some cases. |
Current prices for 304 in China average $1,831 per ton, while the US market reports $3,389 per ton. For 316, China posts $1,589 per ton, the US reaches $3,376 per ton, and Germany stands at $3,012 per ton. These figures highlight the persistent gap between Asian and Western markets.
Note: Monthly prices for both grades can fluctuate based on raw material costs, supply chain disruptions, and seasonal demand shifts.
Global austenitic stainless steel price benchmarks reveal a split market. Asia continues to offer the most competitive rates, driven by lower production costs and strong regional demand. Europe faces downward pressure on price due to weak demand and increased imports from Asia. The US market stands out for its higher prices, shaped by trade policies and domestic supply constraints.
The Section 232 tariffs play a major role in shaping us stainless prices. The following table illustrates how tariffs and logistics affect landed costs for imports into the US:
| Metric | Southeast Asia (to USA) | India (to USA) | EU (to USA) | USA (Domestic) |
|---|---|---|---|---|
| Base Price Index | 100 | 105 | 135 | 150 |
| Logistics & Insurance Index | 15 | 18 | 12 | 5 |
| Applicable Tariffs (Index) | 25 (Section 232) | 25 (Section 232) | 0-25 (Varies) | 0 |
| Estimated Landed Cost Index | 140 | 148 | 147-172 | 155 |
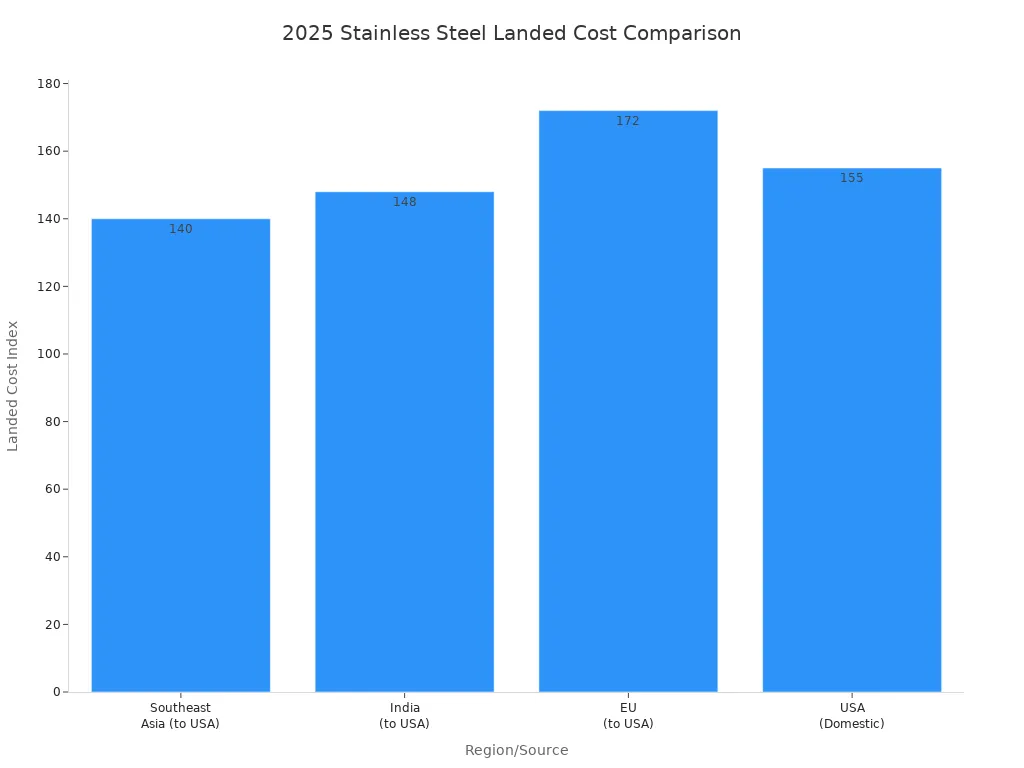
Asian producers benefit from lower base prices and tariff-free trade within the region. However, Section 232 tariffs add a 25% tax to imported steel, raising the landed cost for US buyers. This policy narrows the price gap between imports and domestic prices, sometimes making US steel more attractive despite higher prices at first glance. The EU also uses anti-dumping duties, but the US tariffs have a stronger impact on price.
Buyers should monitor monthly prices and tariff changes closely, as these factors can shift sourcing strategies and affect total procurement costs.
US stainless prices remain the highest among major markets in 2025. Section 232 tariffs, combined with logistics and insurance costs, push the landed cost index for imports close to or above domestic prices. Domestic prices for 304 and 316 grades reflect these pressures, with 304 at $3,389 per ton and 316 at $3,376 per ton. These higher prices result from trade barriers, steady but flat demand, and increased production costs.
The US market size for austenitic stainless steel is part of a global industry projected to reach $12.97 billion in 2025. Analysts expect the market to grow at a compound annual growth rate of 14.48% through 2032, driven by expanding industrial applications and a focus on sustainable materials. This growth outlook supports continued investment in domestic production, even as buyers face higher prices and complex sourcing decisions.
The austenitic stainless steel price landscape in the US will likely remain volatile. Buyers should track current prices, monthly prices, and tariff developments to optimize their purchasing strategies.
Stainless steel prices experienced notable shifts from 2024 into 2025. In the United States, prices declined during the first quarter of 2025. This drop followed a period of slight increases in late 2024, which stemmed from Federal Reserve rate cuts and temporary boosts in demand. By mid-2025, analysts expect prices to rise again as economic conditions stabilize and demand from construction and automotive sectors recovers. In China, government infrastructure projects in late 2024 led to a temporary price increase, especially for 304 grade. Europe saw a downward trend in prices during the same period, driven by lower feedstock costs and subdued industrial demand.
Several factors contributed to price spikes and drops in the austenitic stainless steel market. The table below summarizes the main drivers and their impacts:
| Factor Category | Specific Factors | Impact on Prices (2024-2025) |
|---|---|---|
| Raw Material Costs | Nickel and chromium price surges | Caused price spikes and tightened supply chains |
| Geopolitical Tensions | Disruptions from Indonesia, Russia | Led to short-term volatility and price spikes |
| Trade Policies | Anti-dumping duties, tariffs on imports | Created supply shortages and price spikes in Europe and North America |
| Production Capacity Expansion | Growth in Asia using electric arc furnace technology | Increased supply, easing price pressures |
| Innovation and Recycling | Low-nickel alternatives, enhanced recycling | Helped stabilize prices |
| Market Demand Dynamics | Growth in construction, automotive, and industrial machinery sectors | Supported demand-driven price increases |
Tip: Companies should monitor trade policy changes and raw material trends to anticipate future price movements.
The global austenitic stainless steel market continues to expand. Experts project a compound annual growth rate (CAGR) of about 5% from 2025 to 2033. This growth comes from rising demand in construction, automotive, and energy sectors. The broader stainless steel market is expected to reach over $134 billion in 2025, with a CAGR of 6.1% through 2034. Asia-Pacific remains a key growth region due to efficient manufacturing and proximity to raw materials. In contrast, Europe and North America face higher prices because of stricter environmental rules and higher energy costs. Despite these challenges, strong demand and ongoing innovation support a positive long-term outlook for stainless steel prices.

Tariffs and trade policies shape the austenitic stainless steel market in 2025. The United States doubled Section 232 tariffs from 25% to 50% on steel and aluminum imports in June 2025. This move disrupted the domestic market, which relies on imports for up to 30% of its stainless steel. Importers raised prices to offset the 50% duty, causing a direct increase in stainless steel prices. Domestic producers benefited from less import competition and focused on austenitic grades like 304. However, weak demand and oversupply limited price growth. Countries such as Vietnam and Indonesia, known for suppressing global prices, did not receive tariff exemptions. Their reduced influence supported higher prices worldwide. The tariffs introduced volatility and upward pressure on prices in the U.S., with ripple effects on global pricing due to shifting trade flows and policy uncertainty. Some countries, like the UK, received temporary exemptions during ongoing trade negotiations, showing that future adjustments remain possible. Trade restrictions, anti-dumping duties, and shifting trade alliances continue to impact the global stainless steel market.
Raw material costs play a critical role in stainless steel pricing. Fluctuations in nickel, chromium, and iron ore prices create unpredictable costs for manufacturers. Nickel prices remain highly volatile due to mining challenges and geopolitical influences. Chromium costs also shift with mining conditions and international trade policies. Supply chain disruptions, such as shortages of critical components and transportation bottlenecks, increase lead times and hamper market growth. Currency exchange rates and speculative trading add further volatility. During the COVID-19 pandemic, supply chain disruptions, labor shortages, and mobility constraints negatively affected the stainless steel market. Trade restrictions and raw material price changes during this period increased price volatility and pressured manufacturing profits. Producers and end-users face challenges in setting stable prices, which slows market growth and stability.
Demand for austenitic stainless steel comes from a wide range of industries. Manufacturing, automotive, energy, electronics, construction, aerospace, food processing, chemical processing, oil and gas, pharmaceuticals, infrastructure, medical devices, and renewable energy all drive demand. The table below summarizes key aspects:
| Aspect | Details |
|---|---|
| Major End-Use Industries | Manufacturing, Automotive, Energy, Electronics, Construction, Aerospace, Food Processing, Chemical Processing, Oil & Gas, Pharmaceutical, Infrastructure, Medical Devices, Renewable Energy |
| Key Material Properties | High corrosion resistance, excellent weldability, superior formability, hygiene, durability |
| Regional Demand Drivers | North America, Europe, Asia-Pacific, Latin America; driven by industrial modernization and infrastructure development |
| Market Growth Drivers | Technological innovation, digital transformation, sustainability trends, renewable energy sector |
Regional demand varies based on industrial modernization and government initiatives. Latin America emerges as a growth region, while Asia-Pacific leads in industrial applications. Higher demand in sectors like renewable energy and medical devices supports steady market growth. Geopolitical events, such as trade policy changes and regional instability, influence supply and pricing. Supply chain disruptions in specific regions can lead to localized price increases. Strategic procurement methods, such as bulk purchasing and long-term contracts, help companies manage risks from market volatility.
The United States reports the highest price for austenitic stainless steel in 2025. Domestic prices for 304 and 316 grades remain elevated due to tariffs, high production costs, and supply chain disruptions. Price volatility in the US market stems from several factors:
Fluctuations in raw material prices, especially nickel and chromium.
Supply chain disruptions that affect the procurement of essential materials.
Economic downturns and international trade conflicts.
Unpredictable demand from key sectors such as automotive, construction, and oil and gas.
These factors make it difficult for manufacturers to maintain stable pricing. The US market often reacts quickly to global events, which leads to sharp price swings. Rising raw material costs and reliance on imports further challenge price stability.
Europe typically acts as a price follower rather than a price setter. The region’s price structure depends on changes in China and the US. European stainless steel prices include base prices plus monthly alloy surcharges, which reflect fluctuating costs for nickel, chromium, and molybdenum. Import volumes into Europe also influence price trends. When Asian imports increase, European prices often face downward pressure. Differences in industrialization and manufacturing bases across the continent create regional variations in demand, which impact price levels. Environmental regulations and supply chain issues can further affect the market.
Note: The EU market experiences less volatility than the US, but it remains sensitive to global price movements and raw material costs.
Asia, led by China, sets the global benchmark for austenitic stainless steel prices. China stands as the largest producer and exporter, which allows the region to offer the most competitive price levels. Several factors drive this position:
Rapid industrialization and urbanization in China, India, and Japan.
Strong manufacturing bases in construction, automotive, and consumer goods.
Excess production capacity, especially in China, which puts downward pressure on price.
Asia Pacific holds the largest share of the global market. The region’s pricing mechanisms often use full prices rather than base prices plus surcharges. Fluctuating raw material costs and strong demand from infrastructure projects shape the price landscape. Asia’s role as a price leader means that changes in its market quickly influence global stainless steel prices.
Industry experts expect the stainless steel price outlook for late 2025 to remain volatile. Several factors drive this uncertainty. Nickel prices, which play a major role in austenitic stainless steel production, often fluctuate due to geopolitical events in countries like Indonesia and Russia. Speculative trading on the London Metal Exchange can also cause sudden cost spikes. These changes create supply chain risks, such as inventory hoarding and logistical delays. Economic challenges, including high inflation and rising interest rates, may reduce demand and put downward pressure on prices. Environmental regulations, which vary by region, could increase production costs and affect global competitiveness. Despite these risks, demand for stainless steel sheets is projected to grow at a steady 4-5% CAGR through 2030. The stainless steel price outlook suggests that price stability will depend on how well companies manage raw material volatility and geopolitical uncertainty. Most analysts forecast that prices may decline or stabilize in 2026, with a potential recovery by 2027 as industrial growth and government policies support demand.
Buyers can take several steps to manage risk and secure better pricing in 2025:
Prioritize suppliers with strong sustainability and recycling practices.
Diversify sourcing across regions, especially in Asia-Pacific and advanced European markets.
Monitor nickel price trends closely and lock in orders early if costs are expected to rise.
Use long-term contracts with price adjustment clauses to hedge against volatility.
Bundle orders or accept flexible delivery schedules to negotiate volume discounts.
Build strong relationships with reputable suppliers for consistent quality and better terms.
Tip: One buyer saved 5% on material costs by accepting a supplier’s standard shipping schedule, showing that flexibility can lead to real savings.
Effective budgeting helps companies manage stainless steel price swings. Consider these approaches:
Optimize contract lengths (3-4 months) to balance price stability and flexibility.
Use forward contracts for nickel to hedge large-volume purchases.
Balance just-in-time inventory with buffer stocks to reduce risk.
Develop direct relationships with mills for preferential supply during shortages.
Monitor market indicators like LME nickel prices and inventory levels to time purchases.
Evaluate alternative grades or sourcing options for cost savings.
Note: Understanding the causes of price fluctuations—such as supply chain disruptions, raw material costs, and geopolitical events—can help buyers plan more accurately and protect margins.
The austenitic stainless steel price remains elevated in 2025, shaped by strong demand, volatile nickel costs, and regional trade policies.
Asia-Pacific leads global demand, driven by rapid industrialization and urbanization, while the US and EU face higher prices due to tariffs and supply constraints.
Market growth continues, supported by infrastructure spending and innovations in stainless steel alloys.
Buyers should monitor market changes, review supplier strategies, and consult updated sources to manage risks and optimize procurement.
Raw material costs, especially nickel and chromium, drive prices. Tariffs, trade policies, and supply chain disruptions also play major roles. Demand from construction, automotive, and energy sectors supports price levels.
Section 232 tariffs, higher production costs, and supply chain issues keep US prices elevated. Asian producers benefit from lower costs and fewer trade barriers, making their prices more competitive.
Buyers can diversify suppliers, use long-term contracts, and monitor market trends. Early order placement and flexible delivery schedules help secure better pricing.
Analysts expect continued volatility through 2025. Prices may stabilize or decline in 2026 as supply chains adjust and demand patterns shift. Monitoring market indicators remains essential.


